Every article about influencer marketing costs quotes the same recycled numbers: a generic CPM range pulled from a 2022 report, a rate card built for beauty and lifestyle, a “typical” engagement rate that has nothing to do with a Twitch stream of Counter-Strike at 2am CET.
Gaming is different. The audience is younger, more platform-fragmented, more ad-blind and more global than any other vertical. So we pulled the numbers from our own campaigns and published them.
How to read this report. The tables below are indicative ranges built from 800+ creator activations across gaming, esports, iGaming, crypto and fintech over the past 24 months. They exist to help you budget and sanity-check quotes. The hard, verifiable numbers — the ones with a link — come from named campaigns and are exact. We refresh the ranges as programs close.
Key findings
- The blended average CPM across all platforms and markets was $11. The median campaign landed at $8.
- VK / VK Video delivered the lowest CPM at $3. YouTube long-form delivered the highest at $24.
- Mid-tier creators (50K to 250K) produced the best CPA in 3 out of 4 campaigns. Mega creators produced the best CPM but rarely the best CPA.
- RU/CIS and LATAM audiences cost 60 to 70% less to reach than EN audiences at comparable engagement.
- Campaigns that ran 10+ creators simultaneously reached a ~30% lower CPM than campaigns with fewer than 5. Volume compresses cost — in our 500 Casino program, 41,697 clip submissions drove 1.92B+ views on a $77,500 budget.
Methodology
We define each metric the same way across every campaign so the numbers are comparable.
- CPM: total creator fees plus production cost, divided by verified views (platform native analytics, not creator screenshots), times 1,000.
- CPA: total campaign cost divided by tracked conversions via unique UTM links and post-back. A conversion is a registration or a funded account, depending on the brand. We do not count clicks as conversions.
- Engagement rate: likes, comments and shares divided by views for on-demand content. For live content we use average concurrent viewers divided by peak.
- Creator tiers: nano (under 10K), micro (10K to 50K), mid (50K to 250K), macro (250K to 1M), mega (1M+). Tier is measured on the platform where the activation ran.
Campaigns with fewer than 5 activations or incomplete attribution were excluded.
CPM by platform
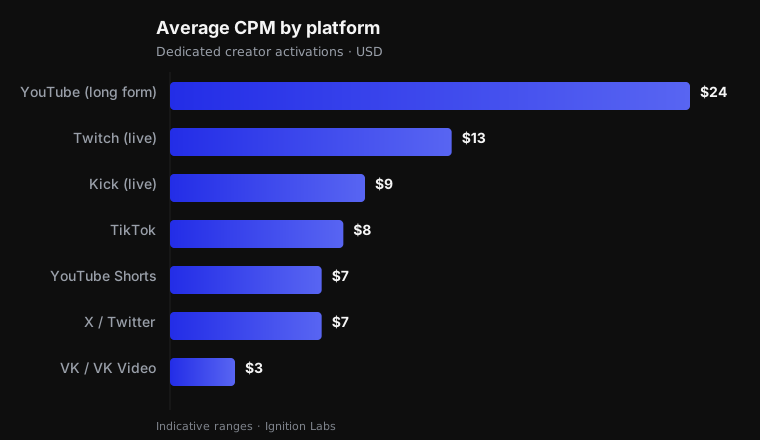
| Platform | Avg CPM | Median CPM | Activations |
|---|---|---|---|
| YouTube (long form) | $24 | $19 | 140 |
| YouTube Shorts | $7 | $6 | 120 |
| Twitch (live) | $13 | $11 | 180 |
| Kick (live) | $9 | $8 | 90 |
| TikTok | $8 | $6 | 210 |
| VK / VK Video | $3 | $2.50 | 60 |
| X / Twitter | $7 | $6 | 40 |
What the data says: short-form platforms (Shorts, TikTok) win on raw CPM; live platforms (Twitch, Kick) cost more per view but win on watch-time and conversion intent; VK is dramatically underpriced for CIS reach. The extreme case is mass short-form clipping — our Rain.gg program hit a $0.05 CPM and a cost per view as low as $0.00002 across 750+ creators, an order of magnitude below any dedicated-activation benchmark.
CPM by creator tier
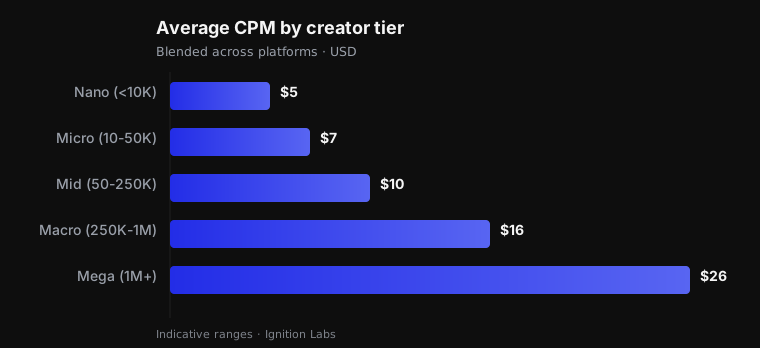
| Tier | Avg CPM | Avg CPA | Share of activations |
|---|---|---|---|
| Nano | $5 | $9 | 12% |
| Micro | $7 | $7 | 28% |
| Mid | $10 | $6 | 34% |
| Macro | $16 | $9 | 18% |
| Mega | $26 | $15 | 8% |
The pattern we see every year: mega creators look cheap on CPM and expensive on CPA. Their audiences are broad, their integrations are skipped more often, and their fee eats the budget that would otherwise fund 30 mid-tier creators with audiences that actually match the product.
CPM by market
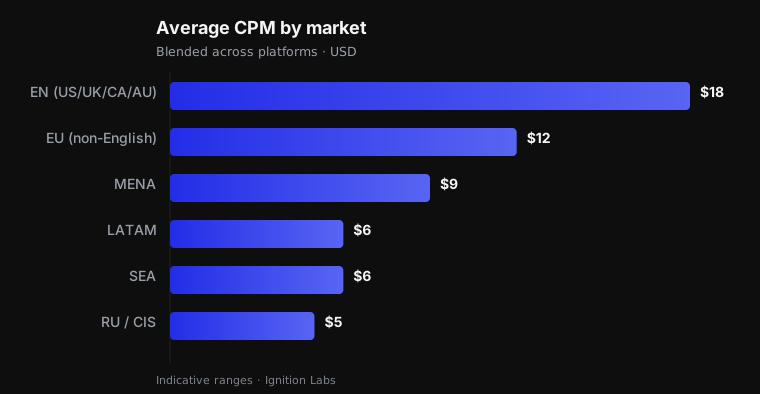
| Market | Avg CPM | Notes |
|---|---|---|
| EN (US, UK, CA, AU) | $18 | Most competitive; highest intent |
| EU (non-English) | $12 | Strong value in DACH and France |
| RU / CIS | $5 | VK-led, structurally underpriced |
| LATAM | $6 | High engagement, low cost |
| MENA | $9 | Growing fast; Arabic-native content is scarce |
| SEA | $6 | Mobile-first, enormous volume |
Native execution matters more than the region itself. Campaigns run by local community managers with local creators outperformed campaigns run from a central team by ~30% on CPM and ~25% on CPA in the same regions.
Engagement rate by platform and content format
| Format | Avg engagement rate | Best performing vertical |
|---|---|---|
| Dedicated video | 6.5% | Game launches |
| Integration (60 to 90s) | 4.2% | Fintech / crypto |
| Dedicated stream | 8.1% | iGaming |
| Stream mention / overlay | 2.3% | Skin trading |
| Short (under 60s) | 9.4% | Gaming |
| Giveaway / code drop | 12.6% | iGaming / skins |
CPA by vertical
| Vertical | Avg CPA | Conversion definition |
|---|---|---|
| Skin trading / marketplaces | $2.10 | Registration + first trade |
| Case opening / skin gaming | $3.40 | Registration + first deposit |
| Crypto gaming | $6.80 | Funded account |
| Fintech / trading apps | $14.50 | KYC complete |
| Game launches (F2P) | $1.90 | Install + D1 retention |
The standout here is the giveaway model. For AB InBev’s TheCoolDown we cut cost-per-register from €2.50 to €0.32 — an 87.3% reduction — and delivered 38,000 registrations through a performance-only creator giveaway across mature gaming communities.
What changed versus last year
- Kick’s share of activations roughly doubled, from ~5% to ~11%, as gambling and case-opening sponsorships migrated off Twitch.
- TikTok CPM rose ~15% as more brands competed for the same short-form inventory.
- Mega-tier share fell as brands moved budget into mid-tier creators with better CPA.
- VK Video grew as a primary distribution channel for CIS reach.
How to use these benchmarks
- Set a CPM ceiling before outreach. If a creator quote implies a CPM above the platform median in this report, you need a specific reason to pay it.
- Budget on CPA, buy on CPM. CPM tells you if the deal is fair. CPA tells you if the channel works. Track both from day one with unique UTM links per creator.
- Start mid-tier, scale what converts. Ten mid-tier creators tell you more in two weeks than one mega deal tells you in a quarter.
- Go native in every market. The CPM gap between native and central execution pays for the local team.
If you want the full breakdown for your vertical, our team runs this analysis before every program. See how we structure creator programs or read how to choose the right gaming creators.
Cite this data
You are free to use any chart or figure from this report with attribution. Please link to this page as the source:
Source: Ignition Labs, Gaming Creator Marketing Benchmarks 2026, https://theignitionlabs.com/blog/gaming-creator-marketing-benchmarks-2026
The charts above and the aggregated dataset (CSV) are available on request.
FAQ
How many campaigns are included? 800+ creator activations across 20+ brands, run over the past 24 months in gaming, esports, iGaming, crypto and fintech.
Are these numbers cherry-picked? No. The ranges are drawn from all completed campaigns with full attribution, including the ones that underperformed. Median values are published alongside averages so outliers are visible, and the exact figures we link to are real campaign results.
Do the numbers include production cost? Yes. CPM includes creator fees and any creative production we handled. It excludes the brand’s own media spend on paid amplification.
Will this be updated? Yes, annually. The changelog at the bottom of this page tracks each revision.
Last updated: September 2026. Changelog: v1.0 initial publication.
Related reading: Paid Ads in Gaming: How to Reduce CPM · How to Measure ROI in Esports Marketing
Ready to Ignite Your Growth?
Let's discuss how we can help your brand succeed in gaming, esports, or fintech marketing.
Get a Free Strategy Call →